

Right holders’ losses due to piracy
05 Feb 2025 • 485 views
Estimated Revenue Losses from Piracy: Insights from Studies and Industry Reports
Content piracy causes substantial revenue losses for creators and rightsholders. This applies to both the entertainment industry (films, music, streaming services) and paid content creators on platforms like OnlyFans and Patreon. Below is an overview of recent studies, reports, and articles estimating the percentage of revenue losses due to piracy. We analyze global and regional data (US, Europe), compare findings from different sources, calculate an average loss rate (across all sources and only peer-reviewed or official studies), and recommend an average benchmark figure for use in marketing materials for content protection services targeting models and creators.
Research Data on Revenue Losses from Piracy
The table below summarizes findings from studies, reports, and articles, ranked by estimated revenue loss due to piracy. Each row lists the source, estimated loss percentage, and a brief context (industry, region).
| Source (Year) | Estimated Loss (%) | Notes (Industry/Context) |
|---|---|---|
| EU Study (2017) | 40% (displacement) ~5% (revenue loss) | Piracy of recent blockbuster movies: 40% illegal views displace legal ones, equivalent to ~5% sales loss. |
| Sweden, Anti-Piracy Law (2014) | 36% | Music sales rose 36% after anti-piracy measures, indicating a similar level of losses prior. |
| GIPC/NERA Report (US, ~2019) | 34% (displacement) 11–24% (revenue) | Movies/TV in the US: piracy displaces up to 34% potential sales, equivalent to 11–24% revenue loss. |
| France, HADOPI Law (2014) | 20–25% | Digital music sales rose 20–25% after HADOPI law, reflecting previously lost revenue. |
| Parks Associates (US, 2023) | 22% (2022) 24.5% (2027 projected) | Streaming video services in the US: ~22% revenue loss currently, expected to rise to ~24.5% by 2027. |
| OnlyFans/Patreon Models (Blog, ~2022) | 10% | At least 10% of income lost by creators due to leaks and piracy on platforms like OnlyFans; similar levels assumed on others. |
| Academic Study, IViR (2018) | 4.1% | Piracy and box-office films: ~46% of illegal downloads displace legal viewing, resulting in ~4.1% box office loss for major films. |
Note: Displacement refers to the percentage of illegal consumption that directly replaces legal sales. For example, a 40% displacement rate for movies means that for every 10 pirated views, about 4 legal views are lost — translating to ~5% revenue loss for new releases. Figures in the table reflect maximum estimated losses; where ranges exist, approximate boundaries are shown. Variation stems from differences in methodology and segment focus: some studies target high-profile releases (where piracy has more impact), while others examine average markets or specific anti-piracy measures.
Average Loss Percentage from Piracy (All Sources)
Estimates of revenue losses from piracy vary widely — from single-digit percentages to several tens of percent. Averaging across all available sources (different industries and methods), the typical loss rate is around ~18%. In other words, nearly one-fifth of potential revenue is lost due to illegal content distribution.
Context matters: studies covering mass-market segments (movies, music, streaming) often report double-digit losses. For instance:
-
US industry analysis estimates 11–24% revenue loss.
-
Streaming services show ~22% losses, expected to rise to ~24–25%.
Conversely, independent academic work sometimes produces more conservative estimates. For example, IViR’s study found only ~4% direct sales reduction for major films despite high piracy rates.
Still, most sources — including peer-reviewed — agree the effect is significantly negative. About 90% of studies report statistically significant sales declines due to piracy.
Thus, even accounting for the spread of data, the overall picture points to revenue losses of 15–20% for many content industry segments — with ~18% as a reasonable average across all sources. This reflects a “general benchmark” — specific cases may see higher losses (e.g., top releases or no content protection) or lower losses (niche projects or strong anti-infringer measures).
Average Loss Percentage (Scientific & Official Studies)
When focusing only on peer-reviewed studies and official reports — excluding journalist articles and creators’ own estimates — the average loss remains similar, or slightly higher.
Official sources include academic research, government and industry reports (e.g., EU Commission studies, international association reports).
From this set, the average loss is in the range of ~19–20%.
This group includes:
-
Studies of anti-piracy laws showing sales increases of 20–36% — indicating comparable prior losses.
-
Industry analysis reports estimating ~11–24% revenue losses.
-
The 2017 EU study, which, while finding no significant average loss across all products, reported substantial effects in blockbuster film segments (~5% sales loss at 40% illegal consumption).
Excluding unofficial estimates barely lowers the average — and in some cases raises it.
For example, the OnlyFans loss estimate (~10%) is below the mean of the others. Without it, the average among scientific and official works is slightly higher.
On the other hand, scientific approaches are usually more cautious: independent economists sometimes report moderate losses (5–15%) in specific cases, while industry reports tend toward upper bounds (20%+).
Still, both confirm meaningful damage: a Carnegie Mellon University review concluded that the overwhelming majority of peer-reviewed studies agree piracy significantly reduces sales across virtually all media sectors.
Conclusion: Around ~18% Revenue Loss
Official data indicate an average potential revenue loss from piracy of ~18%.
In scientifically grounded sources, estimates range from a few percent in some niches to several tens of percent in the most vulnerable segments, but the average remains close to one-fifth of the market.
Sources:
- 2006 - The True Cost of Motion Picture Piracy to the U.S. Economy (Stephen E. Siwek) - Report (industry)
- 2007 - The True Cost of Sound Recording Piracy to the U.S. Economy (Stephen E. Siwek) - Report (industry)
- 2010 - Intellectual Property: Observations on Efforts to Quantify the Economic Effects of Counterfeit and Pirated Goods (U.S. Government Accountability Office (GAO)) - Report (government)
- 2009 - Piracy of Digital Content (Piotr Stryszowski; Danny Scorpecci) - Report (international, OECD)
- 2016 - The Economic Cost of IPR Infringement in the Recorded Music Industry (EUIPO) - Report (official, industry)
- 2017 - Estimating displacement rates of copyrighted content in the EU (Martin van der Ende et al.) - Report (government, EU)
- 2017 - The Economic Impacts of Counterfeiting and Piracy (Frontier Economics for ICC BASCAP & INTA) - Report (industry, international)
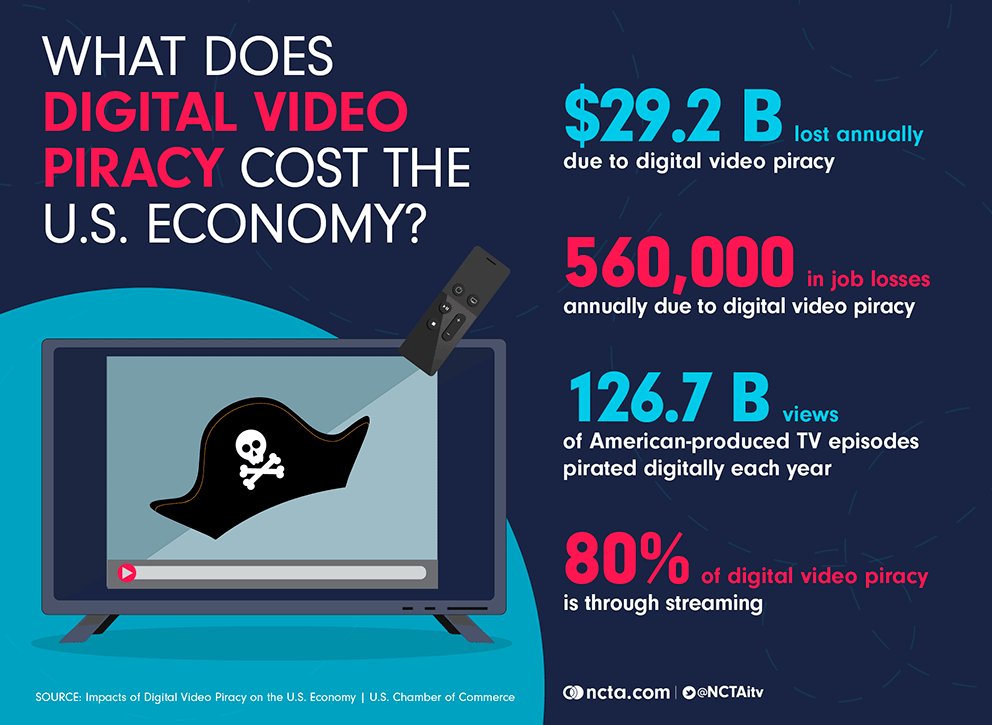
- 2019 - Impacts of Digital Video Piracy on the U.S. Economy (David Blackburn; Jeffrey A. Eisenach; David Harrison Jr.) - Report (industry)
- 2007 - The Effect of File Sharing on Record Sales: An Empirical Analysis (Felix Oberholzer-Gee; Koleman Strumpf) - Academic study
- 2006 - Measuring the Effect of File Sharing on Music Purchases (Alejandro Zentner) - Academic study
- 2014 - Piracy and music sales: The effects of an anti-piracy law (Adrian Adermon; Che-Yuan Liang) - Academic study
- 2014 - Gone in 60 Seconds: The Impact of the Megaupload Shutdown on Movie Sales (Brett Danaher; Michael D. Smith) - Academic study
